Prediction of Drying Rates
DOI 10.1615/hedhme.a.000333
3.13.4 Prediction of drying rates
E. U. Schlünder
The drying rate –dY/dt depends primarily on the moisture content Y of the product. Figure 1 shows a typical drying rate function –(Ms/A)(dY/dt = Ṁv = f(Y) for constant drying conditions such as temperature T∞, humidity X∞, pressure P, and mass transfer coefficient βg between the surface of the product and the drying agent (air). Ms is the amount of dry product, and A is the interfacial area. Starting the drying process from the initial moisture content Y0, the drying rate remains constant until the so-called critical moisture content Ycc is reached. Within this “constant rate period”-regime I-the liquid evaporates directly at the external surface area A of the product. The capillary suction of the liquid-filled pores is strong enough to replace the liquid being evaporated at the surface. The temperature of the product in the steady state is identical with the wet-bulb temperature TWB as derived in the aforegoing section.
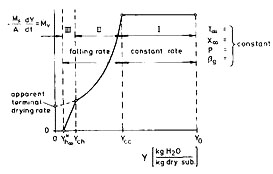
At the critical moisture content Ycc, the moisture level starts to retreat. The capillary forces are no longer sufficient to transport the liquid to the surface. Thus a layer of dry material forms with additional heat and mass transfer resistances, which lowers the drying rate in regime II.
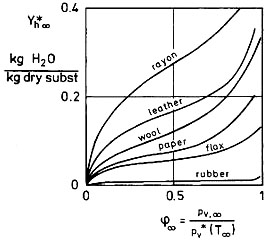
At low moisture contents a second critical moisture content Ych emerges due to sorptive bonds of the product, which lower the vapor pressure of the liquid. This additional effect brings the drying rate down to zero at the hygroscopic equilibrium moisture content Yh∞[T∞, 𝜑∞(X∞), P ], which depends on the temperature T∞, the humidity 𝜑∞(X∞), and the pressure P of the drying agent according to the so-called sorption isotherms as shown in Figure 2 [𝜑∞ = pv∞/p*v∞ (T∞) = x̃∞/x̃∞* (T∞) = relative humidity at T∞]. Regime III is called the hygroscopic one. As the hygroscopic bonds vanish, one observes an apparent terminal drying rate, provided that the sample is a slab (e.g., not a sphere).
... You need a subscriptionOpen in a new tab. to view the full text of the article. If you already have the subscription, please login here