Navigation by alphabet
A B C D E F G H I J K L M N O P Q R S T U V W X Y ZIndex
Layout and Performance Data
DOI 10.1615/hedhme.a.000332
3.13.3 Layout and performance data
E. U. Schlünder
A. The Mollier chart
In most cases the drying agent is air. During the drying process, heat is transferred from the air to the product while vapor is transferred from the product to the air. This combined transfer process of heat and mass leads to a change of enthalpy as well as of the vapor concentration of the drying agent. It is convenient to depict those changes in an enthalpy concentration chart for the drying agent, the so-called Mollier chart for humid air as shown in Figure 1 [see also Krischer and Kast (1978)].The enthalpy of the humid air is defined as
\[\label{eq1} h=c_{p,\rm{air}}T+X\left(\Delta h^{0}_v+c_{p,\rm{vapor}}T\right)\tag{1}\]
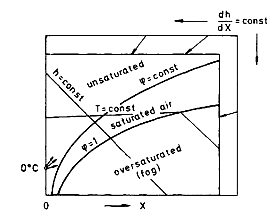
cp,air (in J/kg dry air K) is the specific enthalpy of the dry air, cp,vapor is that of the pure vapor. Δhv0, in joules per kilogram, is the standard latent heat of vaporization at 0 °C, X is the vapor content in kilograms vapor/kilogram dry air or the absolute humidity, T is the temperature in degrees celsius, and h is the enthalpy of the humid air in joules per kilogram dry air. 𝜑 in Figure 1 is the relative humidity, which is equal to the ratio of the partial vapor pressure pv to the saturation vapor pressure at a given temperature pv*(T). The absolute humidity can be calculated from the partial vapor pressure pv and the total pressure p:
... You need a subscriptionOpen in a new tab. to view the full text of the article. If you already have the subscription, please login here